Business Intelligence
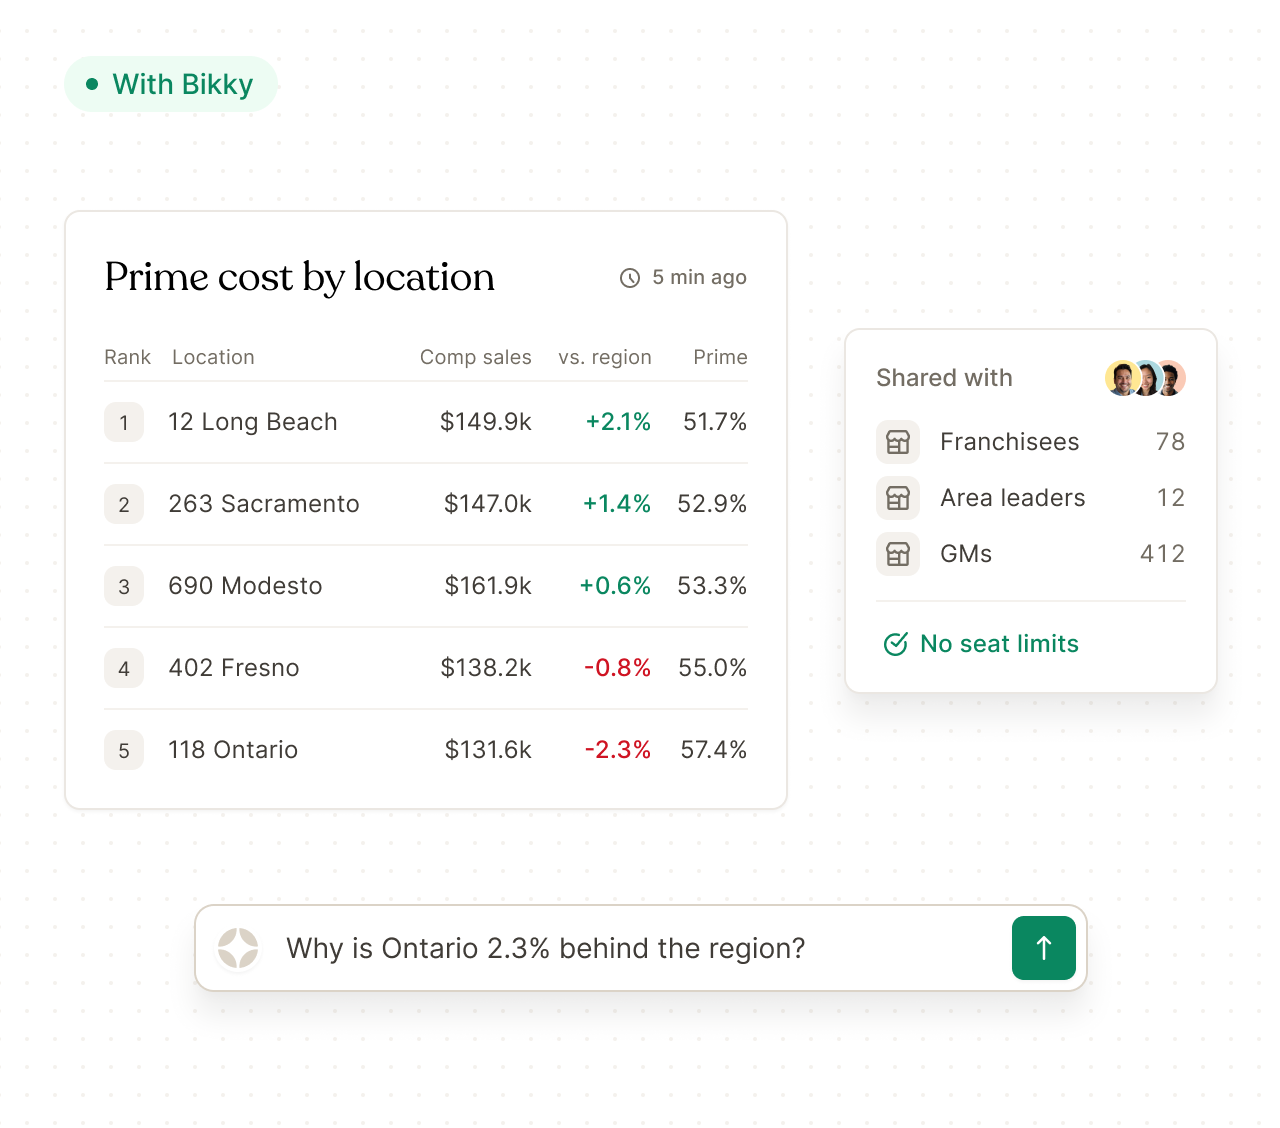
A single source of truth for your sales and prime costs
See what moves the P&L in minutes with modern, AI-native reporting across comp sales, labor, COGS, menu performance, and more.
Book a demo
Revenue
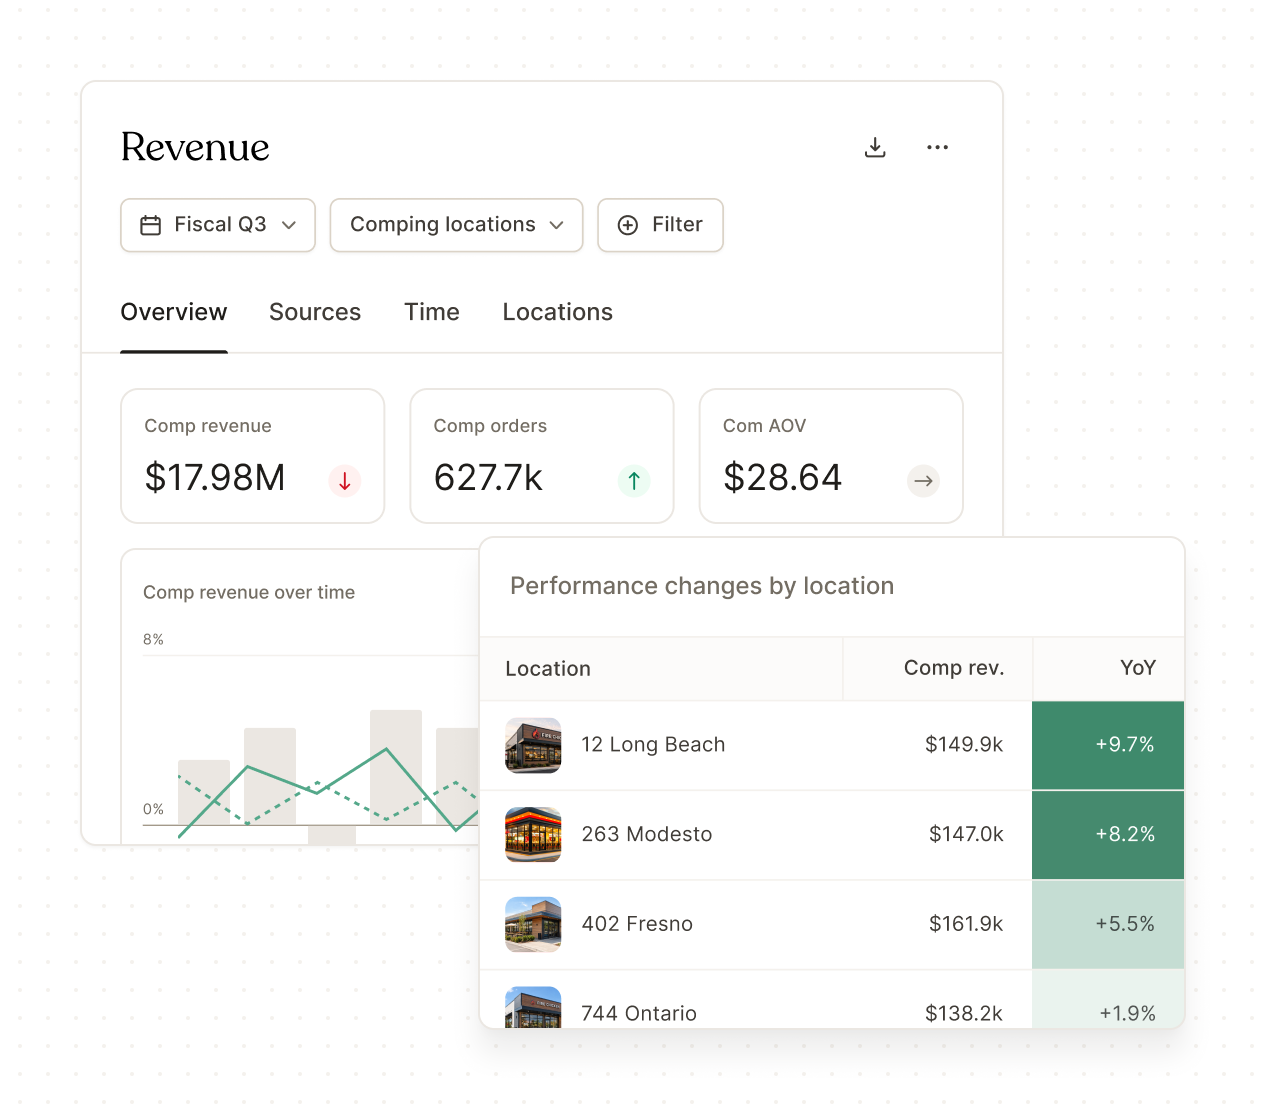
Understand comp sales from every angle
Break down changes in traffic and check across any market, location, channel, daypart, GM, or franchisee in just a few clicks.
Labor
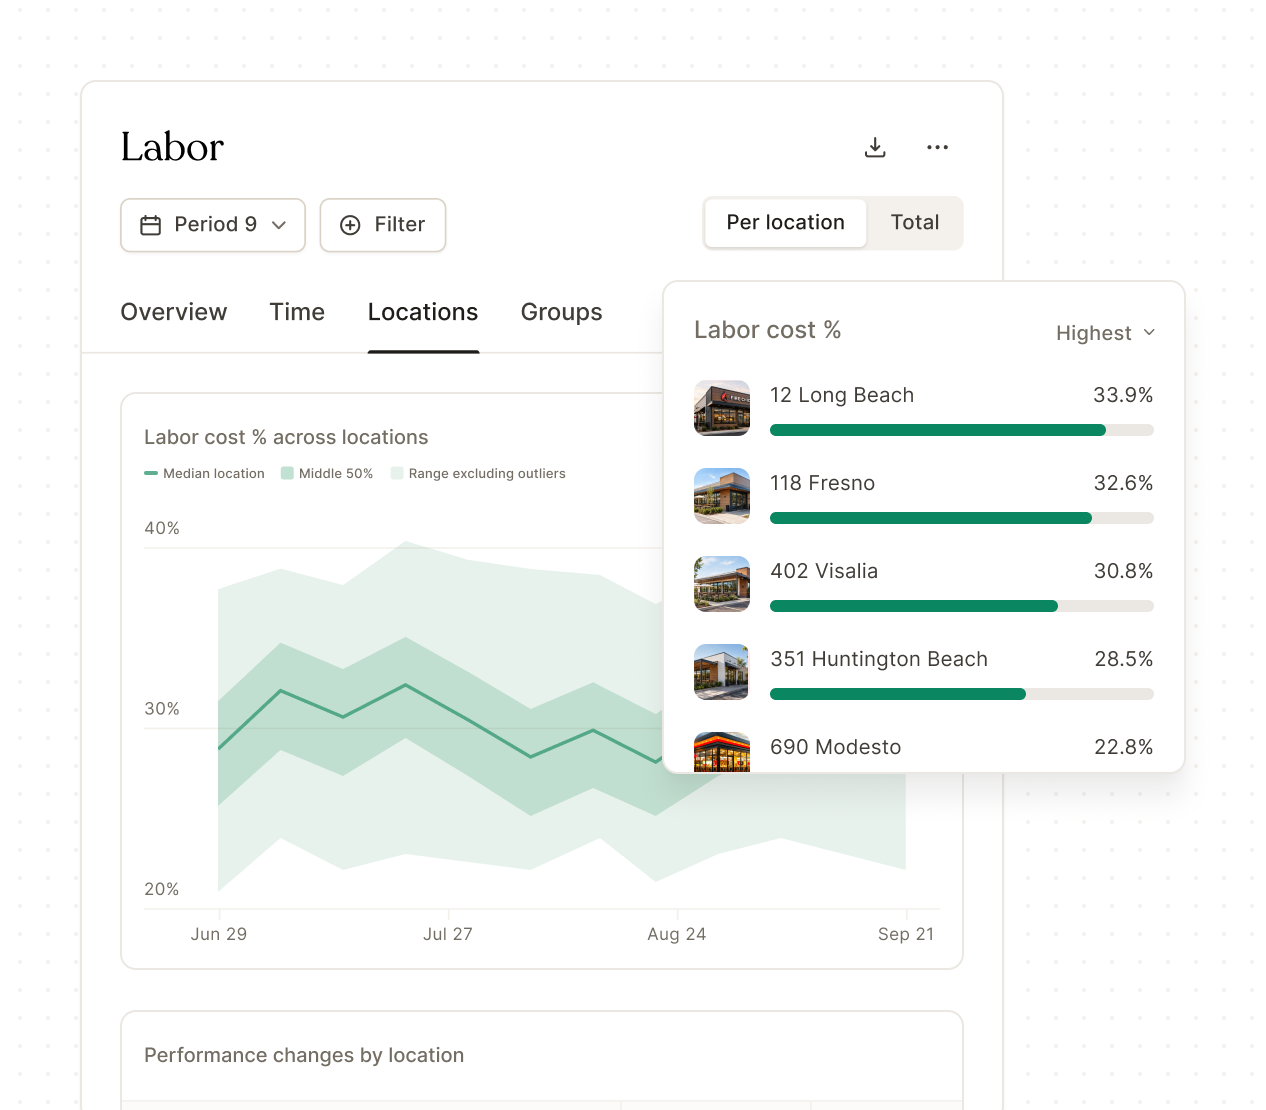
Get more from every labor dollar
Compare labor cost, productivity, and overtime across locations and dayparts to identify where staffing is out of step with demand.
Cost of goods
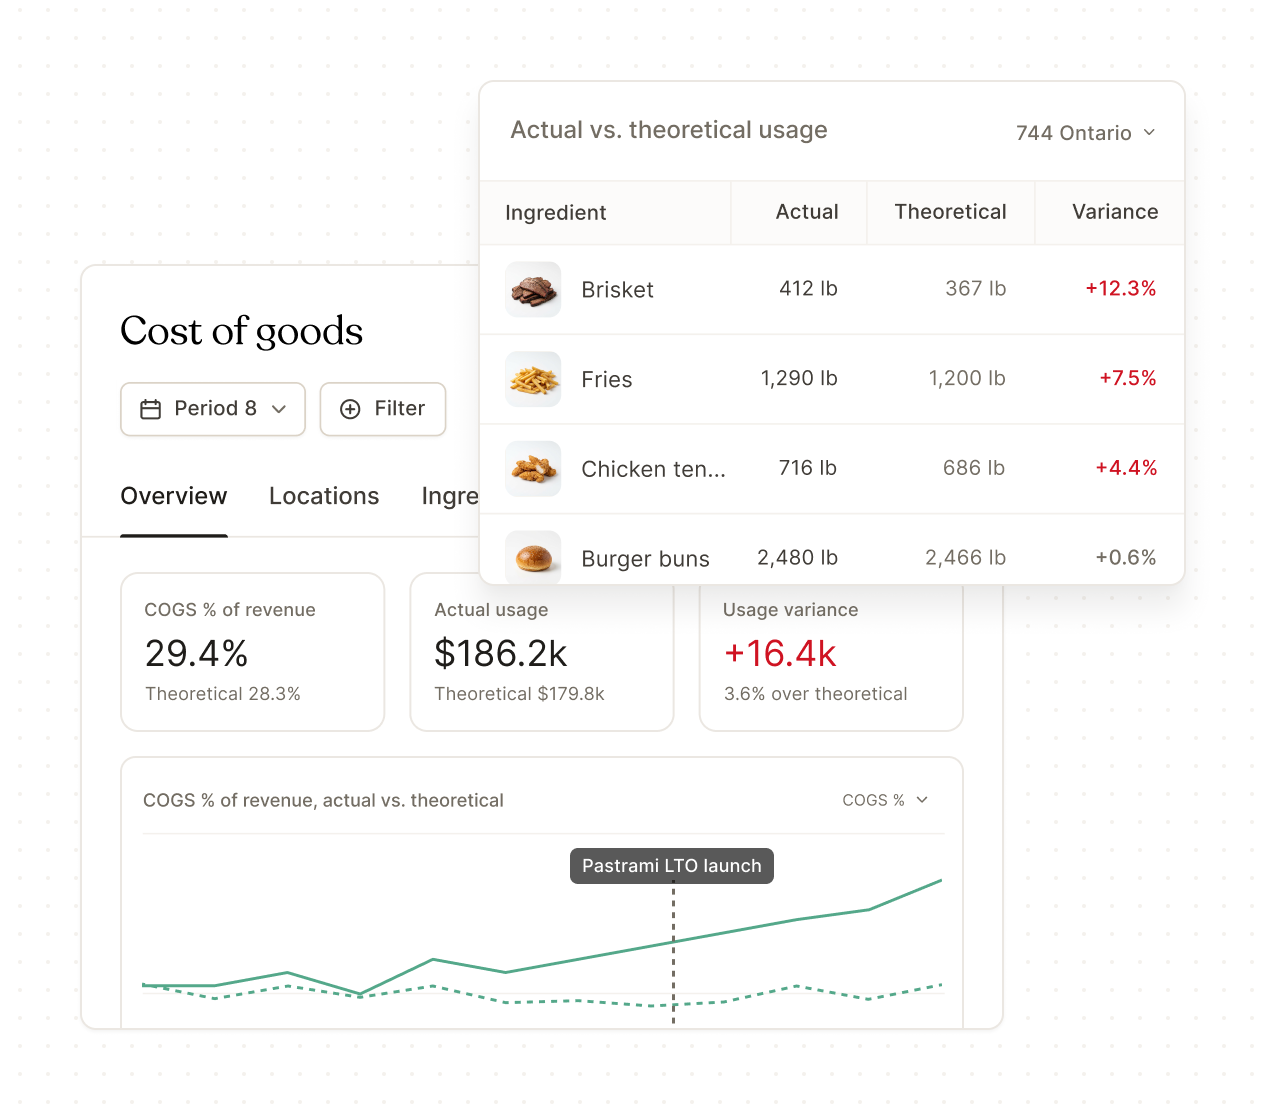
Close the gap between actual and theoretical food cost
Your menu may be built for profitability, but in-store execution doesn't always follow the plan. Pinpoint where food costs are running ahead of expectations, down to the location and ingredient level.
Unified reporting
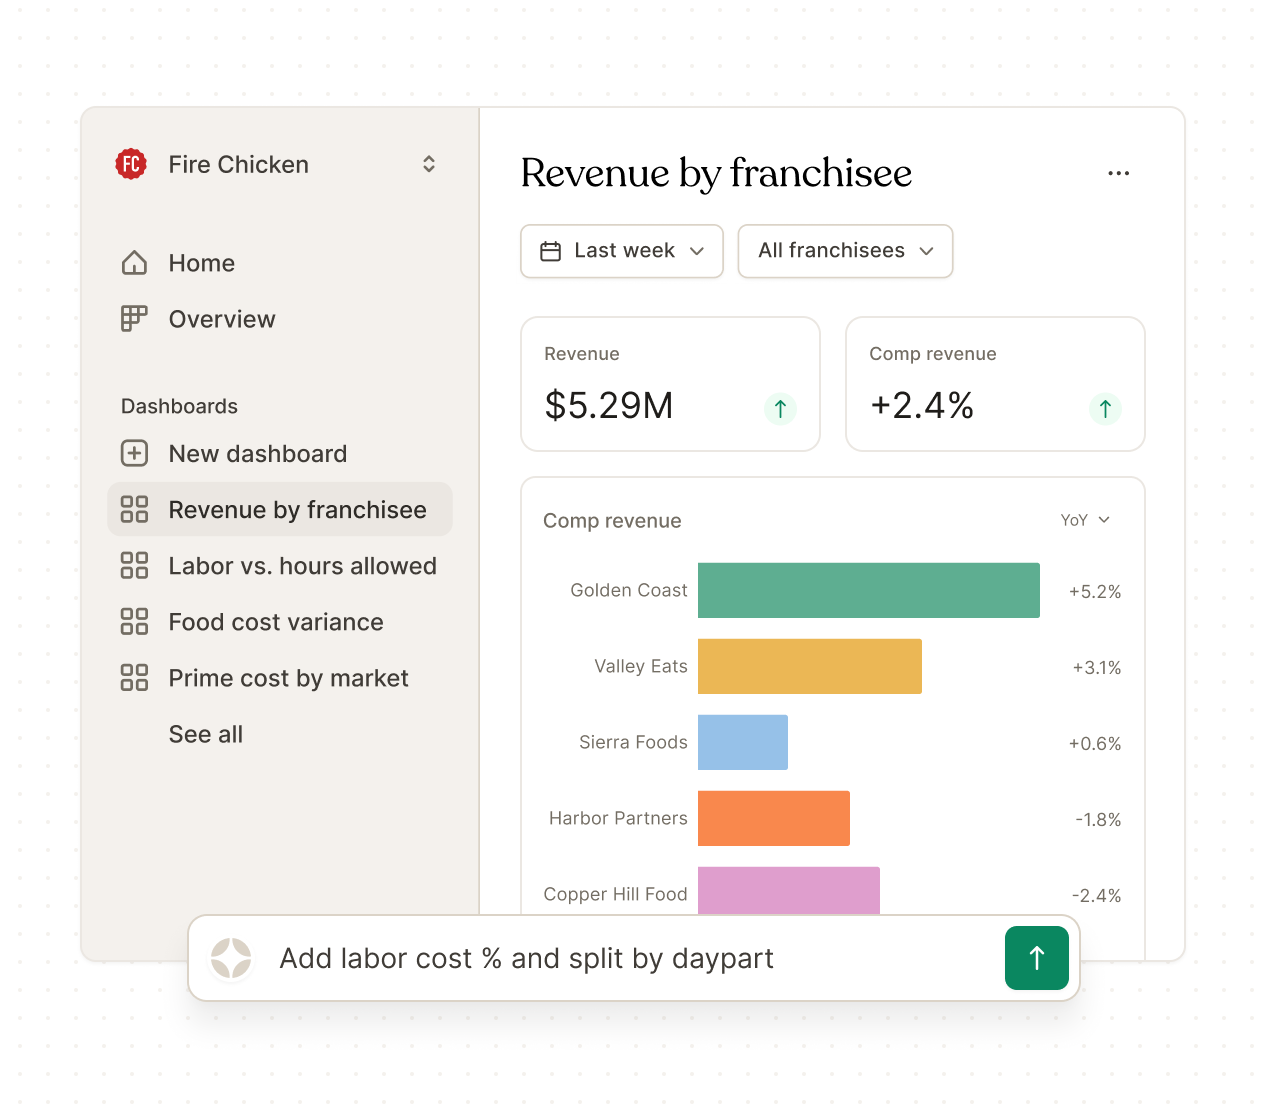
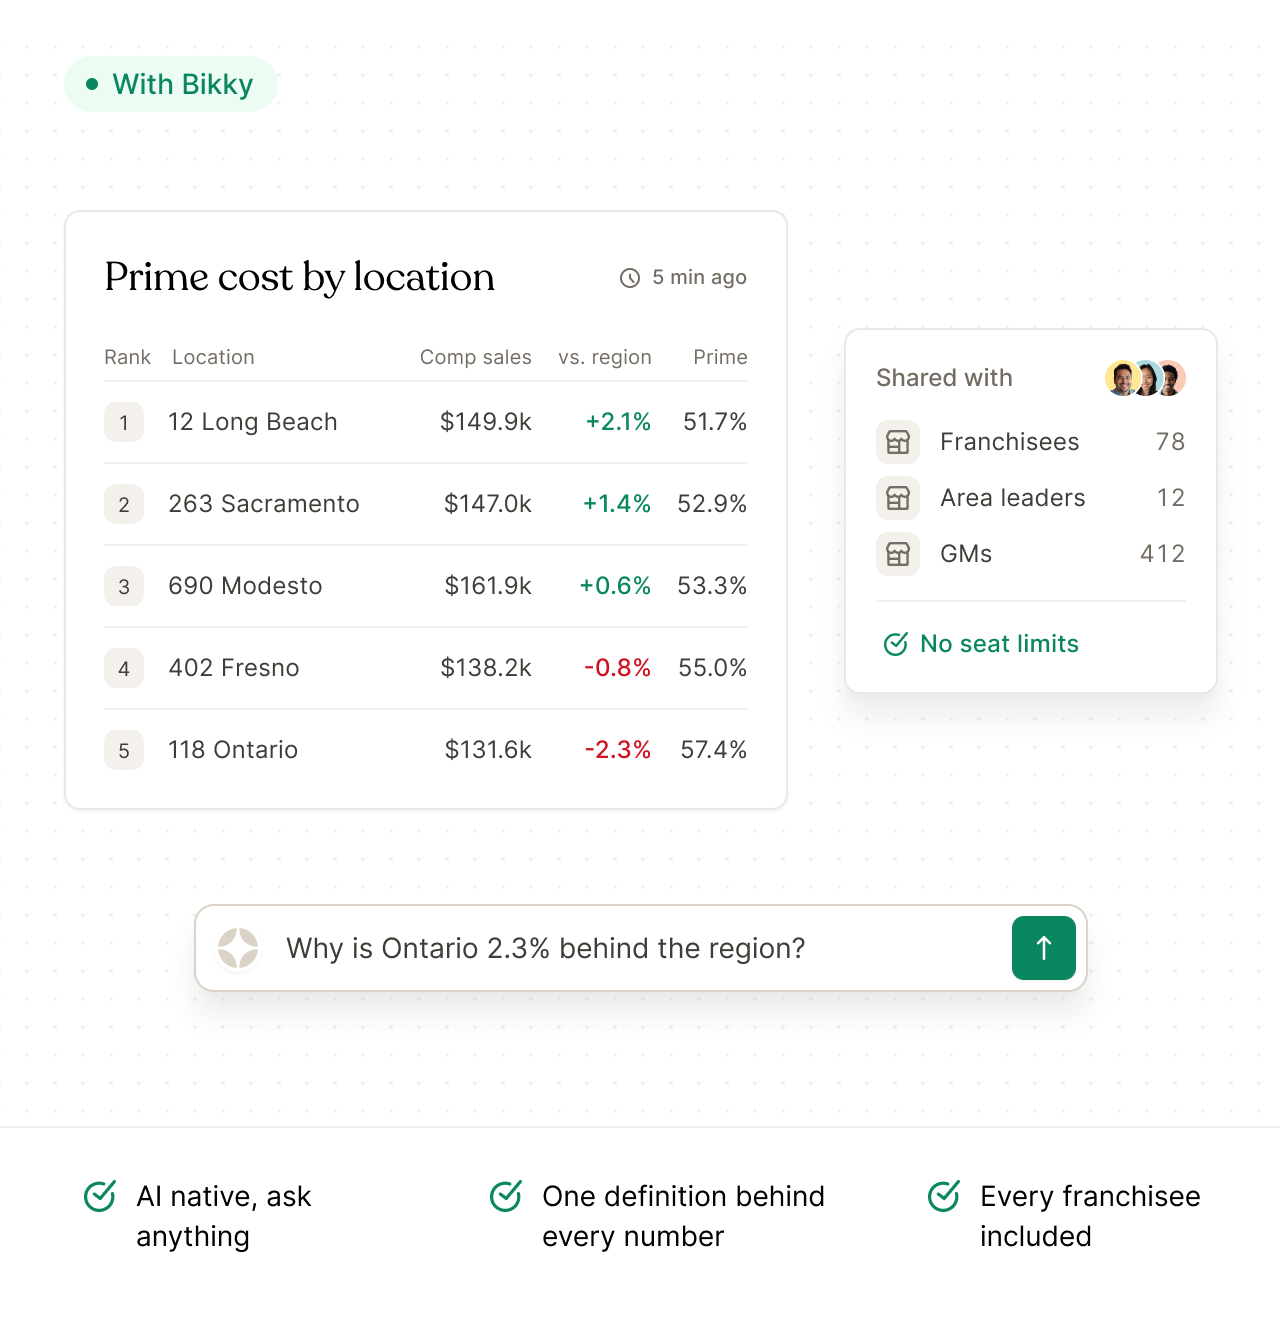
Every report, built on data you trust
Build any report in minutes on a data foundation everyone - from the C-suite to your franchisees - understands and trusts.
Configuration
Your business rules, applied to every report
Set your fiscal calendar, comping rules, dayparts, and location groups once. Every dashboard, export, and scheduled report follows the same definitions.
Fiscal calendar
Report by your fiscal weeks and periods, including 4-5-4 calendars, so comparisons line up with how you plan and review performance.
Comping rules
Define when locations qualify for comp reporting and how remodels, closures, and transfers affect comparisons.
Dayparts & business days
Set your dayparts and opening and closing times so every transaction is attributed to the correct business day.
Location groups
Build custom location groups by market, franchisee, trade area, vintage, remodel cohort, and more to easily compare performance across reports.
Comparisons
Compare performance against prior periods, plan, or other locations to understand where you're ahead or falling behind.
Menu groups and modifiers
Entrees, appetizers, sides, LTOs, combos, modifiers - organize and reconcile your entire menu for comprehensive reporting at the group or item level.
Consolidation
Built to replace your legacy reporting
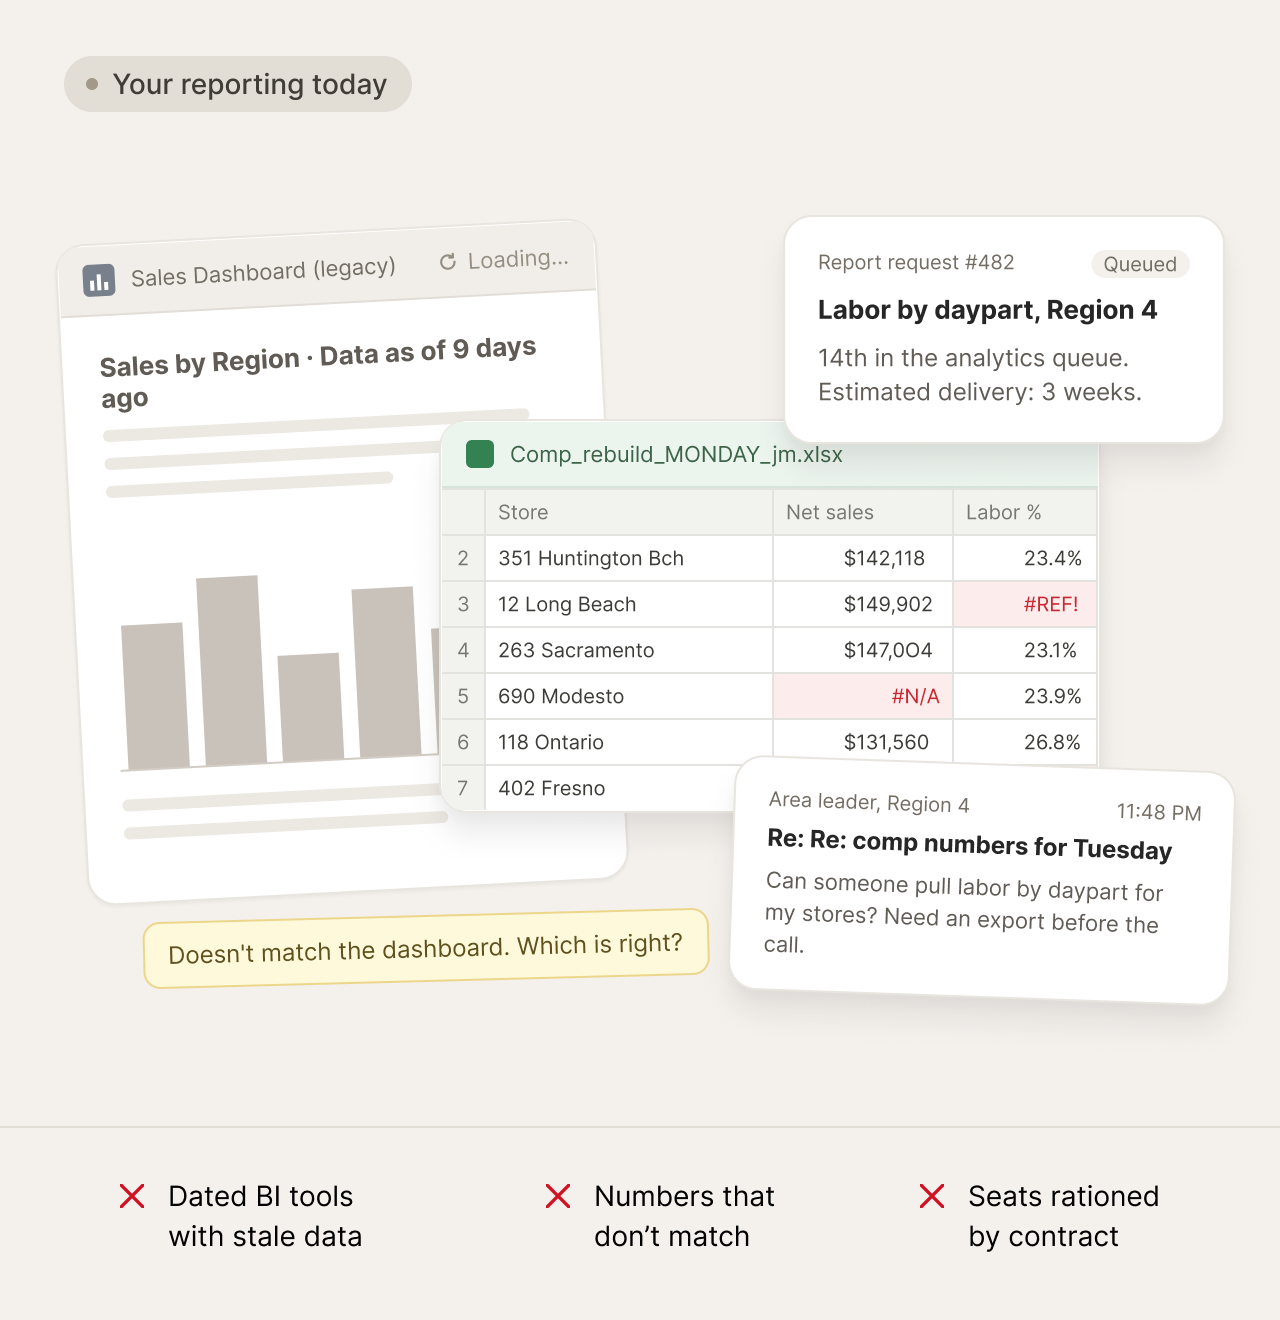
Replace disconnected reporting tools, spreadsheets, and manual reconciliation with one platform for your most critical operational metrics.
Results
Fewer hours in, more decisions out
Every brand reports the same shift: less time producing the work, more time acting on it. The revenue follows.
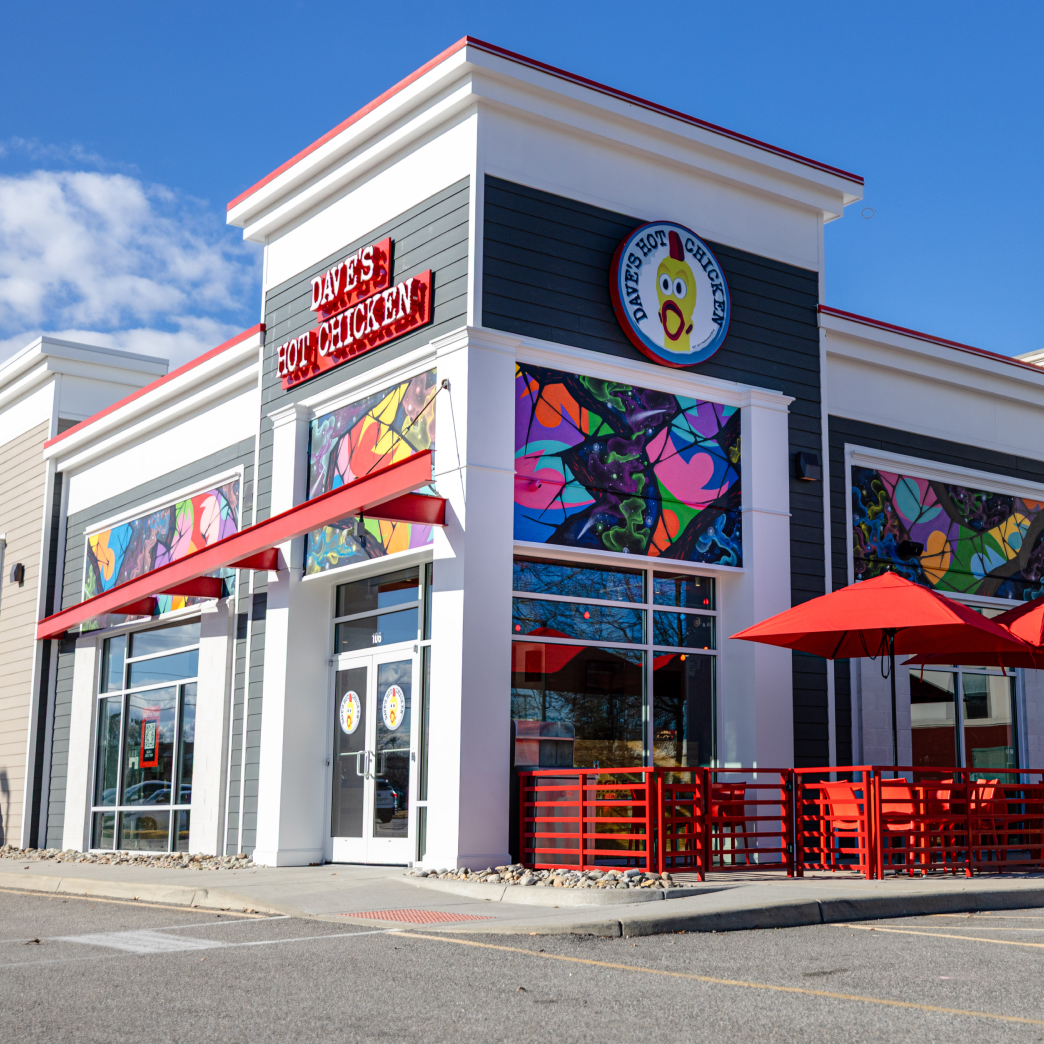
“I used to spend the first week of every month building the report. Now it's waiting for me Monday and I spend that week acting on it. Same team, four times the output.”
Greg Kotnis
Chief Operating Officer, Dave’s Hot Chicken
Read the story
14
hrs
Given back to each operator every week
+
19%
Repeat guest revenue in year one
6
x
More analysis completed per month